You are here:
WindowsManagement.com > Performance Monitoring Software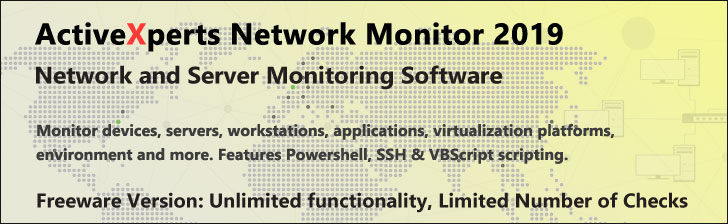
Performance Monitoring Software
ActiveXperts Network Monitor 2019 |
|
|---|---|
|
|
ActiveXperts Network Monitor 2019 is a leading solution for monitoring every aspect of your LAN and WAN network. It proactively manages your network servers, network devices, web servers, databases, etc. It detects and corrects problems before network users start complaining. The product is scalable. It includes a large set of pre-defined, built-in monitoring checks; |
|
When problems are detected, you're immediately notified by network message, e-mail, pager, or SMS message. When a failure is detected, the network monitor tool will try to recover the problem by running a system administrator defined program or by restarting a process. The product includes build-in monitor rules for: Active Directory, ADO databases, ADSI, Disk Drives, CPU Usage, Disk Spaces, Event Log (with content checking), Exchange, File Existence (with content checking), FTP sites, HTTP(s) (with content checking), ICMP/Ping, MS SQL Databases, Novell NDS, NNTP news servers, NTDS (NT4 compatible DS), NTP time servers, ODBC Databases, Oracle Databases (SQLNet), POP3 Mail servers, Powershell, Printers, Processes, Services, SMTP Mail servers, SNMP, TCP ports (with handshaking), UDP, UNIX Shell Scripts (RSH), VBScript (custom scripts), WMI and more. ActiveXperts Network Monitor 2015 is a complete solution. Regardless of what you want to monitor, ActiveXperts Network Monitor supports it all at a cost-effective price. |
|
|
|

EventSentry |
|
|---|---|
|
|
EventSentry is an easy-to-use, flexible yet affordable real-time log, system and network monitoring and software/hardware inventory suite for servers and workstations. EventSentry monitors log files as well as the availability of all important system components, including their performance. |
|
Receive critical alerts or consolidate all your logs in one place with real-time event log, log file and Syslog monitoring. Sophisticated rule sets ensure you only get the alerts you need, and our powerful web-based reporting gives you a unique insight into all of your logs. Monitors all critical server components to prevent outages before they ripple through your infrastructure. Important system data is collected for real-time dashboards as well as capacity planning. Unique software and hardware inventory options sweeten the deal. Monitor any IP-based device such as routers, switches and Linux/BSD hosts via PING, TCP and SNMP. Respond to critical SNMP traps and monitor & collect any numerical SNMP counter. Our ARP monitoring component lets you know when new network devices appear on your LAN and tracks them. Takes the pain and complexity out of compliance and helps you with a variety of government and industry regulations such as PCI, HIPAA, SOX, GLBA, FISMA and more. Powerful reporting with scheduled jobs make compliance easy and useful. EventSentry helps you become compliant with minimal effort and great flexibility. |
|
|
|
IPHost Network Monitor |
|
|---|---|
|
|
IPHost Network Monitor is a reliable network and server monitoring software that allows availability and performance monitoring of web sites and applications, mail, db and other servers, various network resources and equipment using industry standard SNMP (on UNIX/Linux/Mac) and WMI (on Windows). |
|
With IPHost Network Monitor you can monitor both Windows and Unix based networks, various servers and network equipment, availability and performance characteristics of web and other applications. Web Transaction monitor for end-to-end monitoring of e-commerce sites and web applications. You can also use any Nagios plugin to monitor what you need with IPHost Network Monitor. The advanced alerting system provides timely notifications using several means such as e-mail, SMS, and instant messengers; the system is also able to execute correcting actions locally or remotely via SSH. Reporting and graphs are available through a web interface. Supported Monitoring Methods:
Supported Alerting Methods:
|
|
|
|
LogicMonitor |
|
|---|---|
|
|
LogicMonitor’s pre-configured, hosted monitoring solution will tell you everything you need to know about the health of your systems, and proactively alert you to any issues, without you having to spend days becoming a monitoring expert, or purchase any costly hardware. Best of SaaS Showplace Award Winner. |
|
Proactive email + SMS alerting
Unified view
Dashboards
Interactive Graphs
Custom graphs
Proactive email + SMS alerting
Unified view
Dashboards
Interactive Graphs
Custom graphs
Reporting
Easy Setup
Cloud Ready
Maintenance-free SaaS architecture
All-inclusive pricing
|
|
|
|
ManageEngine OpManager |
|
|---|---|
|
|
OpManager is a complete, end-to-end Network & IT infrastructure monitoring platform that offers advanced fault and performance management across WAN, VoIP services, network devices, servers, applications, databases and other IT infrastructure such as printers, UPS etc.. |
|
With OpManager, you can group infrastructure that are part of a particular business service (e.g. the ERP system) so as to monitor the business service's performance as a whole unit. On identifying poor performance, you can then dig into specific pain-points at the device-level or individual link/interface level. In-built, advanced fault and performance functionalities help ensure an always up and optimized IT infrastructure. With intuitive charts and reports showing current and past performance trends, OpManager also facilitates important capacity planning decisions. OpManager offers:
OpManager is a cost-effective and scalable network management software designed for managing today's complex, growing networks. The Pricing begins at $995 for monitoring upto 50 devices and the small network 10-node edition is available free of cost! |
|
|
|
Zyrion Traverse |
|
|---|---|
|
|
Zyrion Traverse is a scalable network & systems monitoring software that presents correlated views of networks, servers and applications. |
|
In addition to systems and network management, Zyrion Traverse also does application monitoring of databases, web apps, java applications, mail servers, exchange, blackberry enterprise server, etc. Some key features include:
Reports include:
Download free trial from www.zyrion.com |
|
|
|